
My name is Data.
I am pretty old, but I am almost ageless.
I have been around for a very long time and have always been a great servant of mankind. This is my story.
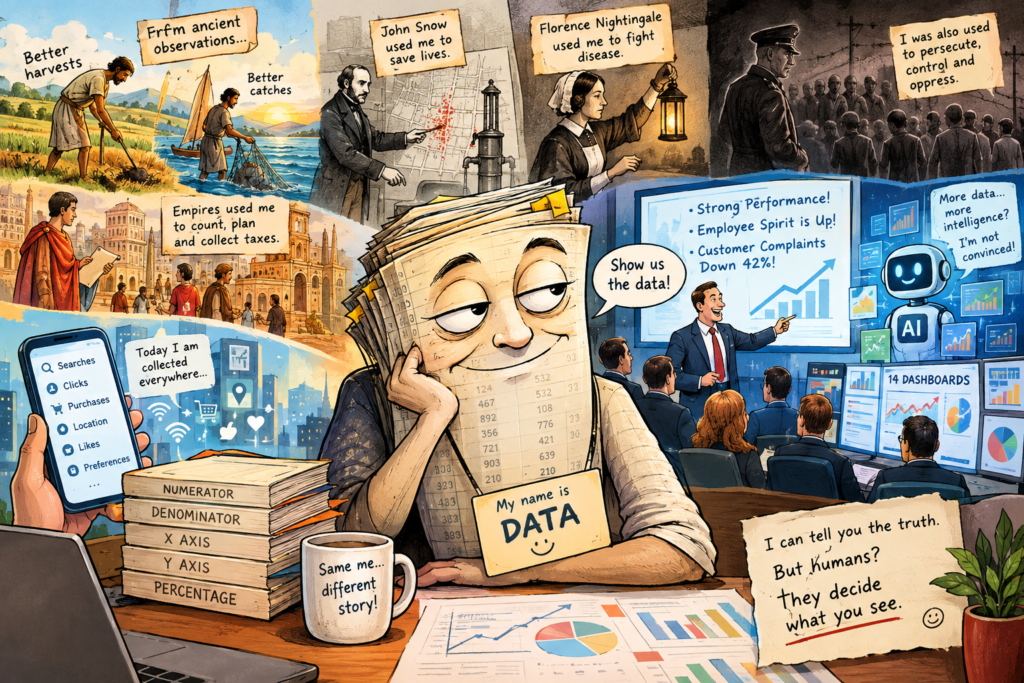
I was born, in some form, when humans first began observing the world around them. Long before anyone had heard of computers, databases, or artificial intelligence, humans were collecting me.
A farmer observed the seasons, a fisherman the tides. They used me to make life better. A better harvest and a better catch were all they wanted.
Nobody called it data then. It was simply knowledge gathered through observation.
As human civilisation grew, so did my importance. Empires used me to understand their population. I helped create infrastructure, create food storage, and, of course, collect more taxes.
Centuries later, governments began discovering another use for me. I could help them solve problems rather than merely count them.
One of the most famous examples came from London in the nineteenth century. Britain lost more than ten thousand lives to cholera in 1853 and 1854 alone. At the time, doctors believed the disease was carried by “miasma” or bad air.
Then in 1854 a gentleman called John Snow did something different. He mapped the cases around Broad Street in the suburb of Soho. A physician by trade, he began studying where the victims lived. To his surprise, he found that the deaths appeared to cluster around a particular public water pump in Broad Street.
Snow persuaded authorities to remove the pump handle, and the outbreak subsided. (Broad Street, now Broadwick Street, has a replica pump without a handle as a memorial to John Snow.)
I had helped in something remarkable. I had helped find a way out of the misery and saved lives.

Then there was Florence Nightingale. She was not merely the famous nurse with the lamp; she found me a great ally. We found that the deaths were more due to poor sanitary conditions than to the actual fighting wounds. She used those numbers to argue for better hygiene, sanitation, and hospital conditions.
I am proud of what I did at times.
But I have another side to my story.
Sometimes, or rather more often, I can also be used for the wrong ends.
Governments have discovered repeatedly that knowing who people are, where they live, what they believe, and how they behave can be a powerful weapon.
And that brings me to the present . Now the irony runs even deeper.
These days, I am an unwilling conspirator.
I am collected everywhere. Every click, every search, every online interaction becomes another piece of me. Now I can tell what people buy, when they buy it, and what they search for. I can even tell you what they nearly bought but then had second thoughts and abandoned at the last moment.
Greedy men collect me through unscrupulous methods. Greedier men then use me to mislead everyone. And somehow, I get the blame.
Corporations love me. They say they are “data-driven.”
I have always wondered what that means.
But I think I know now. It just means that if the data supports your idea, you are making a data-driven decision. If it does not, you simply need to “look at the data differently.”
I have been through this enough times to know what comes next.
Tweak the numerator or the denominator, and I can make a disaster look like a triumph. Tell people that profits grew by 20 percent but forget to mention that they grew from ₹10 to ₹12, and suddenly the company looks like the next global giant.
Take a percentage without explaining what it is a percentage of, and I can be magic.
I can be mischievous on a graph. Depending on where I am, I can tell a different story. Change the starting point of a graph or stretch the scale, and I can make a mountain look like a molehill, or the other way around.
Data and the corporate battle
The modern corporate world has discovered my greatest talent. I can be made to prove whatever you already believe. I am the first one they turn to when they need an excuse they could not find otherwise.
The trick is not to ask me the right question. The trick is to ask me the question that produces the right answer.
A company has had a terrible quarter. Sales are down, customers are leaving, costs are rising, and employees are unhappy.
Naturally, management decides to do something.
“Show us the data,” they say.
I arrive nervously. I am fidgety.
Someone opens a PowerPoint presentation. It is suitably titled:
Our Strong Performance in a Challenging Environment.
I look around the room. Strong performance? I am fairly sure sales are down 18 per cent. But someone has discovered that customer engagement is up 4.7 per cent. Engagement with what? The complaints inbox? Another line says that expected demand is higher by 26 per cent based on the number of enquiries.
Someone has dressed himself in a borrowed suit and made himself look like a messiah.
The next slide announces:
Employee Spirit Is Up.
This is the employee satisfaction survey.
Only 68 per cent of employees responded. Of those, 61 per cent said they were satisfied. The presentation concludes: 61 per cent of employees are satisfied.
I quietly point out that 61 per cent of 68 per cent is not quite the same thing as 61 per cent of the workforce.
I am told to stop being negative.
Then comes the customer presentation.
Customer Complaints Down 42 Per Cent!
Everyone applauds. I try to tell them that the company quietly removed the customer-service telephone number from its website three months earlier. Someone more evil never acknowledged a complaint and removed an uncomfortable piece of me from the list. The only decision left is whether they place me above or below the dividing line.
I am beginning to feel used.
Then comes the annual strategy meeting. This is where the real damage is done.
A senior executive stands up and announces, “We need to become a truly data-driven organisation.”
Everyone applauds. I have heard this before.
It is usually followed by fourteen dashboards and a hundred parts of me in different colours. They call it data intelligence while I look at it dumbly.
The dashboards multiply. They breed like rabbits. There is a dashboard for sales, one for customers, one for employee productivity, one for performance, and another showing how well all the other dashboards are performing. I have been drowned in pie, line and bar charts.
Nobody knows what to do with any of them. But they all know that dashboards hide the inconvenient truth rather well.
Everyone feels safer because there are graphs. Graphs are the best camouflage for corporate frailty and incompetence.
Then someone discovers artificial intelligence and feeds me into it.
Now I am terrified. They tell me that if you feed enough of me into a machine, the machine becomes intelligent. I remain unconvinced. I have spent thousands of years watching humans collect information and still make remarkably foolish decisions .
Just putting me into a new bigger machine will not fix that. It may just help them make more foolish decisions, faster, and with greater confidence in the result.
I am still the servant I always was. I can tell you how many people crossed a bridge, how many crops were harvested, how a disease spread, or how a business performed.
I can tell you how many of the customers are happy, and how many curse your company under their breath.
But I do not lie. Humans do and make me do it too.
I merely sit quietly in the numerator, the denominator, the X-axis or the Y-axis, waiting for someone to place me where they want me. I feel helpless but then that is what modern-day life has brought to me.
Treat me honestly, and I can illuminate the truth. Misuse me, and I can justify almost anything.
So the next time someone walks into a boardroom and confidently announces, “The data clearly shows…” do not applaud too quickly.
Ask me nicely and I may spill the beans, and have something interesting to say.




2 Comments
Outside the box thinking right there,brilliant.
Thanks Alan